Marginal Design
An aspect of the cost of design is illustrated in the graph below, it is a general illustration that shows that as you design for increased completeness the costs rise exponentially. Additionally, because the curve is asymptotic at completeness equals one hundred percent, total completeness is impossible. An example of this curve is removing a pollutant from water. To remove the first fifty percent of the pollutant costs about twelve dollars, but to remove ninety percent of the pollutant costs about ninety dollars. To remove one hundred percent of the pollutant would cost infinite dollars, it can’t be done.

The job of the engineer is to decide where along this curve her design is to lay. This marginal design requires the engineer to balance the cost of a design with the public’s willingness for failure of the design.
Another aspect of marginal design can be illustrated by the graph below that shows as you reduce the consumption of time or other resources. For instance, assume that a country is reducing its consumption of oil where one hundred percent of consumption is happening now. In order to produce or procure that last five percent of oil takes a large amount of “Difficulty” where difficulty is the dirtiest, most expensive, or other undesirable characteristic. Looking at the situation another way, by reducing oil consumption from one hundred to ninety five percent of the current total, the dirtiest and most expensive oil is forgone. In other words, reducing the first five percent of oil is much more valuable than reducing consumption from, for instance, fifty to forty five percent.
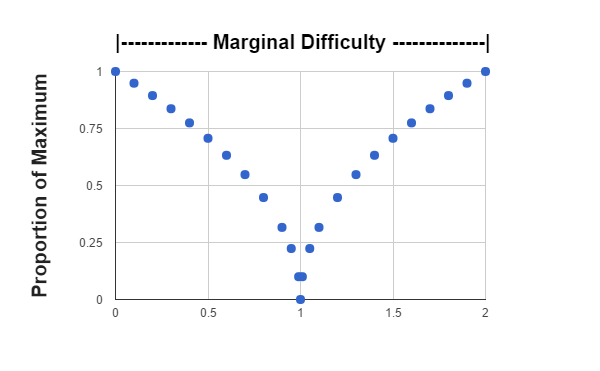 The combination of these two curves demonstrate the power of designing at the margin, a significance that is often lost on the general public.
No comments:
Post a Comment